Mastering the foreign exchange market requires more than simply reading charts—it demands a nuanced understanding of multiple technical indicators aligning in one area. Confluence zones occur when various forms of market analysis converge to highlight a potential entry or exit point. By focusing on these powerful intersections, a trader can increase the probability of success while managing risk effectively in volatile currency pairs.
Understanding Confluence Zones in Forex
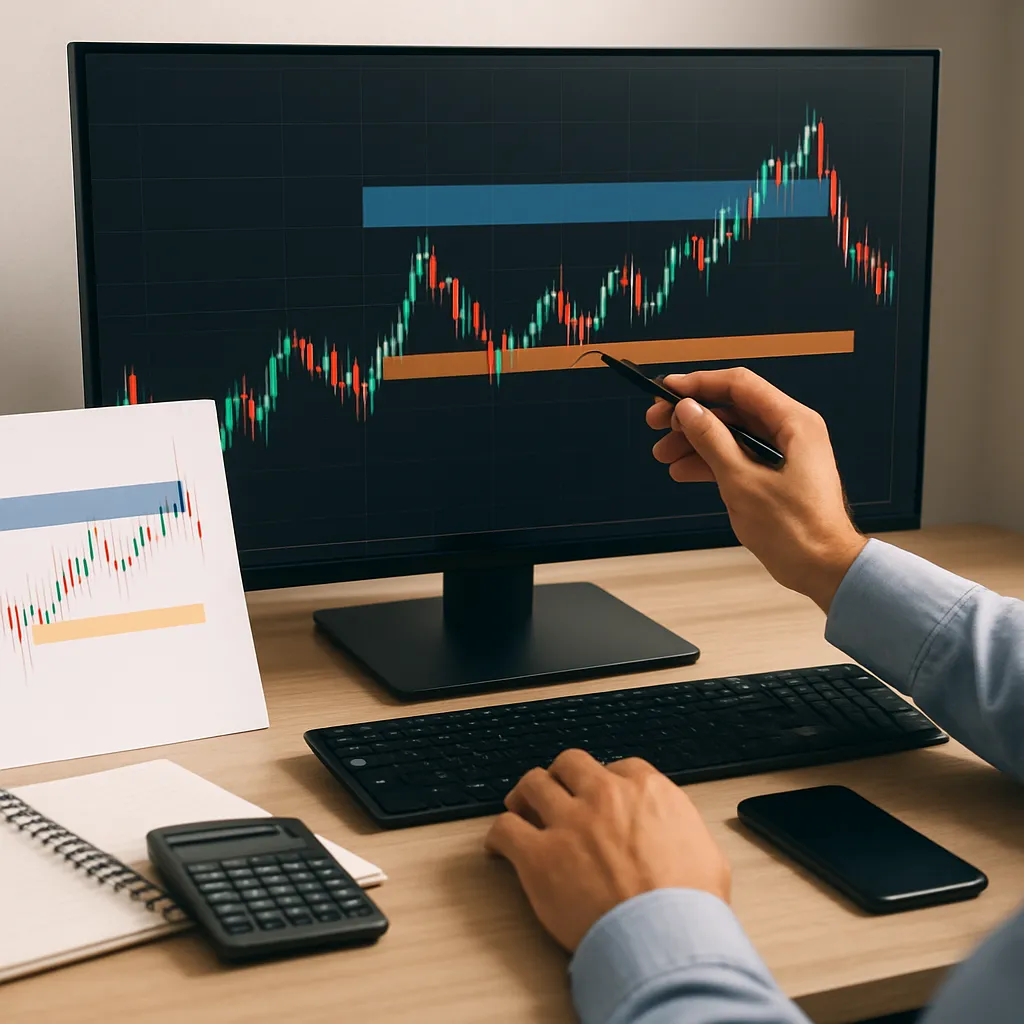
Confluence zones are areas on a price chart where two or more significant factors coincide. These factors can include Fibonacci retracement levels, horizontal support levels or resistance levels, moving averages, pivot points, and trendlines. The idea is simple: when multiple indicators point toward the same price region, that area gains increased relevance and the likelihood of a meaningful market reaction grows.
Key Components of Confluence
- Trendlines: Connecting swing highs or lows to visualize prevailing direction.
- Moving Averages: Dynamic support and resistance, often the 50, 100, or 200-period simple or exponential.
- Fibonacci Retracement: Popular levels at 38.2%, 50%, and 61.8% that reveal potential pullback zones.
- Horizontal Support and Resistance: Historic pivots where price reacted previously.
- Order Flow: Volume profile peaks or significant bid/ask imbalances that validate a zone’s strength.
Each instrument—EUR/USD, GBP/JPY, or AUD/CAD—behaves differently, but confluence remains a universal concept. Aligning these tools can transform ordinary chart observations into robust trading strategy decisions.
Identifying Key Confluence Factors
Locating a confluence zone begins with selecting the right timeframes. A daily chart might reveal major Fibonacci or trendline interactions, while a four-hour or one-hour chart refines entries. Combine data from multiple timeframes to pinpoint precise levels where several factors intersect:
- Mark major swing highs and lows on the daily chart to draw trendlines and identify pivot points.
- Overlay Fibonacci retracement from the most recent significant move—upward or downward.
- Add two moving averages (for example, 50 and 200 periods) to capture medium- and long-term dynamics.
- Scan the four-hour chart for price clusters touching or bouncing off those daily zones.
- Use volume or depth-of-market tools to confirm if institutions are active near that level.
When at least two or three elements overlap, you have established a legitimate technical confluence zone. Such zones often act as springboards for new trends or reversal points after corrections.
Practical Steps for Zone Detection
- Draw horizontal lines at prior highs and lows. These reveal historical supply and demand areas.
- Determine the direction of the long-term trend: always trade in line with the dominant flow.
- Apply Fibonacci retracements on the latest swing to uncover backup support or resistance.
- Place moving averages and check for crossovers or price touches exactly at those Fibonacci panels.
- Look for chart patterns (double tops, head and shoulders) forming within the suspected zone.
By layering these techniques, the probability of a strong market reaction increases. This structured approach prevents random or emotional trades.
Crafting a Trading Plan Using Confluence Zones
A disciplined trading strategy hinges on clear rules. Once a zone is identified, follow this framework:
- Define entry criteria: eg., a bullish candlestick pattern or a breakout above a trendline within the zone.
- Set stop-loss slightly beyond the zone’s boundary to account for market noise.
- Calculate position size based on risk tolerance, typically no more than 1–2% of account equity.
- Outline profit targets using neighboring resistance or support, ATR-based multiples, or risk-to-reward ratios of at least 1:2.
- Plan adjustment rules: if price stalls mid-zone or triggers partial fills, consider scaling into the position.
Example: Suppose EUR/JPY is uptrending and retraces to a 61.8% Fibonacci level that coincides with a 200-period exponential moving average on the four-hour chart. A bullish engulfing candle within that band would constitute a high-probability entry, reinforced by rising volume. Place a stop-loss 20 pips below the confluence and target prior swing high or measured move extension.
Risk and Money Management
Even the strongest confluence zones can fail. Incorporate solid risk management by:
- Adhering to predetermined risk-reward ratios.
- Avoiding overleveraging, especially during low-liquidity hours.
- Monitoring multiple positions to ensure total risk exposure remains within limits.
- Regularly reviewing historical performance to refine zone definitions.
Advanced Techniques and Real-world Examples
After mastering basic confluence, traders can explore sophisticated methods:
- Volume Profile Integration: Overlay high-volume nodes atop confluence zones to find institutional footprints.
- Multiple Timeframe Confirmation: Match daily, four-hour, and hourly charts to see if the same zone holds across scales.
- Correlation Analysis: Confirm confluence in related pairs (eg., USD/CAD and CAD/JPY) for inter-market alignment.
- Seasonal or Macro Themes: Combine fundamental catalysts—like central bank policy—with technical confluence.
Case Study: In mid-September, USD/CAD formed a confluence zone at 1.3600 area where a downward trendline, a 50% Fibonacci retracement, and a historical support level met. A bullish pin bar candle confirmed the bulls were in control. Traders who respected that alignment rode the subsequent nine-handle rally.
Monitoring and Adapting
Markets evolve, and so should your approach. Maintain a trading journal documenting each confluence-based trade: entry, stop, target, outcome, and notes. Use that data to tweak zone definitions, adjust moving average periods, or refine candlestick filters.
By combining multiple elements into a coherent plan, traders transform scattered signals into a unified edge. Confluence zones thus act as beacons in the often turbulent sea of Forex, guiding disciplined decision-making and enhancing the probability of sustained profitability.