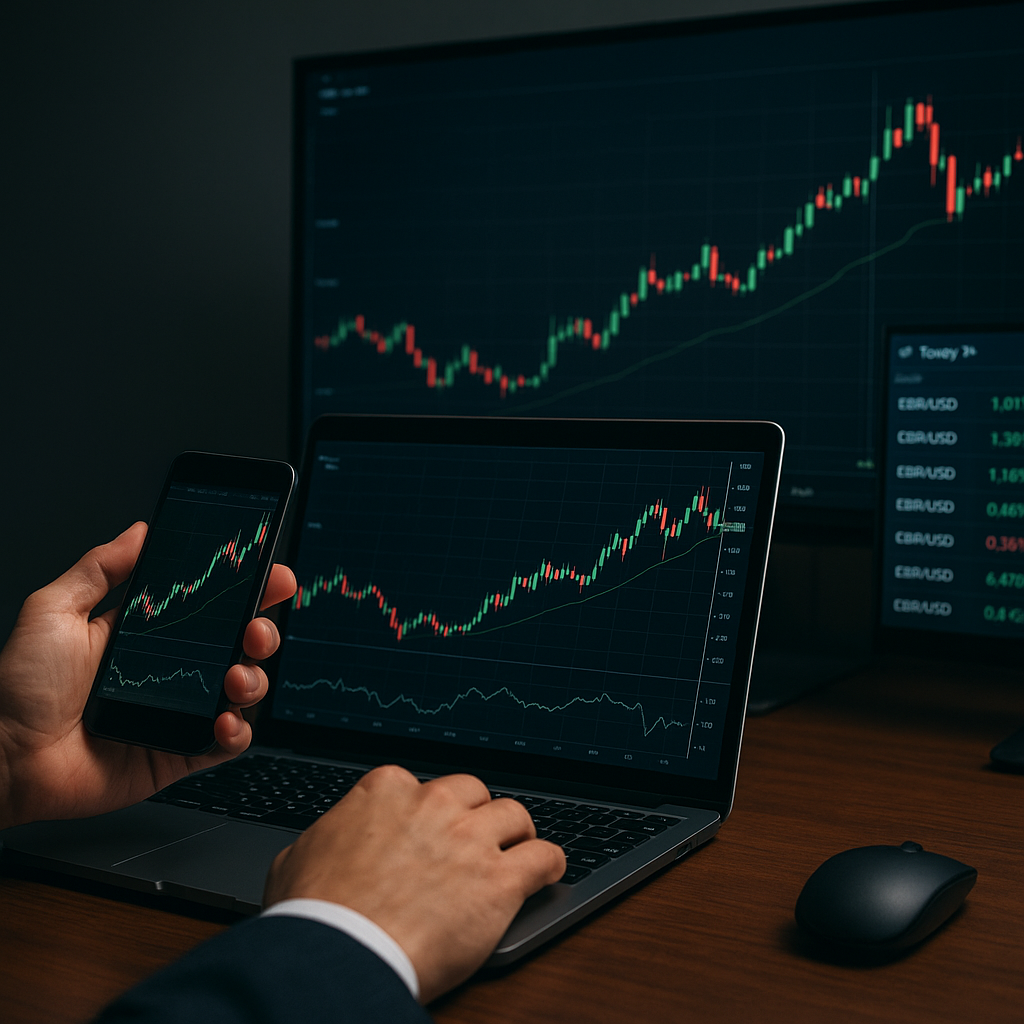
Mastering the art of evaluating currency price movements demands discipline, a structured methodology, and a deep understanding of the forces shaping exchange rates. By integrating multiple analytical approaches, you can transform raw data into actionable insights. Whether you’re eyeing the EUR/USD or exploring exotic crosses, these professional-level techniques will help you navigate the complex world of forex with confidence.
Understanding Forex Market Dynamics
The foreign exchange arena stands out for its unparalleled liquidity and round-the-clock operation. Every day, trillions of dollars change hands, creating opportunities and risks for traders worldwide. Key features to grasp include:
- Major currency pairs (e.g., EUR/USD, USD/JPY) vs. minors and exotics.
- The role of central banks and monetary policy in shaping supply and demand.
- Market sessions (Asia, Europe, North America) and their impact on volatility.
- Interbank network and electronic brokering systems.
Understanding these fundamentals builds a solid foundation. It also clarifies why prices shift rapidly during announcements and thin trading hours. Tracking session overlaps helps in identifying peak activity windows, during which spreads narrow and trading opportunities multiply.
Technical Analysis Techniques
Professional chartists rely on price history to forecast future movements. By dissecting patterns, they identify prevailing trends and potential reversal points. Core methods include:
1. Trendlines and Chart Patterns
- Drawing diagonal lines to connect consecutive swing highs or lows.
- Recognizing continuation formations like flags and pennants.
- Spotting classic reversal shapes such as head-and-shoulders or double tops.
These visual tools help pinpoint breakout zones. A convincingly broken trendline often triggers increased order flow in the breakout direction.
2. Technical Indicators
- Moving Averages (MA): smoothing price data to reveal underlying momentum.
- Relative Strength Index (RSI): measuring overbought or oversold conditions.
- MACD (Moving Average Convergence Divergence): detecting shifts in trend strength.
Combining multiple indicators avoids overreliance on a single signal. For instance, using MA crossovers with RSI extremes can filter out false breakouts and confirm genuine momentum shifts.
3. Oscillators and Volume Analysis
- Stochastic oscillator: capturing rapid price swings and identifying early turning points.
- Volume indicators (on platforms that offer on-chart volume): confirming the strength behind price movements.
When price rises on increasing volume, the rally gains credibility. Conversely, muted volume during breakouts may suggest a lack of institutional participation, warning of potential failures.
Fundamental Analysis and Economic Indicators
Beyond charts lies the realm of macroeconomics. Currency values reflect relative economic strength, interest rate differentials, and geopolitical developments. To trade like a professional, monitor:
- Fundamental data releases: GDP growth rates, unemployment figures, inflation reports (CPI, PPI).
- Central bank decisions on benchmark leverage rates: interest rate hikes or cuts.
- Trade balances and current account statistics, which affect supply-demand equilibrium.
- Geopolitical events: elections, trade negotiations, or unexpected crises.
Interpreting these releases requires context. A slightly weaker unemployment number might be bullish if it reduces the chance of a rate hike. Conversely, a surprisingly high inflation print can spark a sharp currency surge on hawkish expectations.
Building an Economic Calendar Strategy
Experts annotate their trading platforms with upcoming events, importance levels, and forecast vs. actual figures. This approach helps in:
- Avoiding erratic price swings during high-impact announcements.
- Positioning before likely market surprises, based on consensus forecasts.
- Adjusting stop-loss and take-profit levels to accommodate wider volatility.
Sentiment Analysis and Market Psychology
Price often reflects collective trader behavior more than pure economic logic. Gauging market mood provides an edge:
- Commitments of Traders (COT) reports reveal large speculator and commercial positions.
- Retail sentiment tools track the ratio of long vs. short positions on major pairs.
- Social media and news sentiment analysis capture crowd bias in real time.
Extreme bullish or bearish readings can signal impending trend exhaustion. For instance, an overly crowded long trade may force a swift pullback once momentum stalls.
Risk Management Strategies
Even the best analysis falters without disciplined risk management. Professionals adopt stringent rules to protect capital and ensure longevity:
Position Sizing and Leverage Control
- Risk a fixed percentage of equity per trade (e.g., 1–2%).
- Use stop-loss orders to cap potential drawdowns.
- Avoid excessive leverage; high leverage magnifies both gains and losses.
Setting Entry and Exit Levels
- Define clear entry triggers based on technical or fundamental signals.
- Place stop-loss orders beyond logical support or resistance zones.
- Determine profit targets using risk-to-reward ratios of at least 1:2 or higher.
By adhering to predefined rules, traders dodge emotional decision-making. Consistency in applying these guidelines distinguishes professionals from hobbyists.
Maintaining a Trading Journal
Recording every trade—entry, exit, reasoning, and outcome—fuels continuous improvement. Reviewing journal entries highlights:
- Recurring mistakes or cognitive biases.
- High-probability setups that consistently deliver positive returns.
- Optimal market conditions for each strategy.
Combining disciplined money management with rigorous analysis equips you to navigate unpredictable forex markets. By mastering these frameworks—technical, fundamental, and psychological—you’ll be well on the path to trading like a professional and achieving sustainable long-term success.