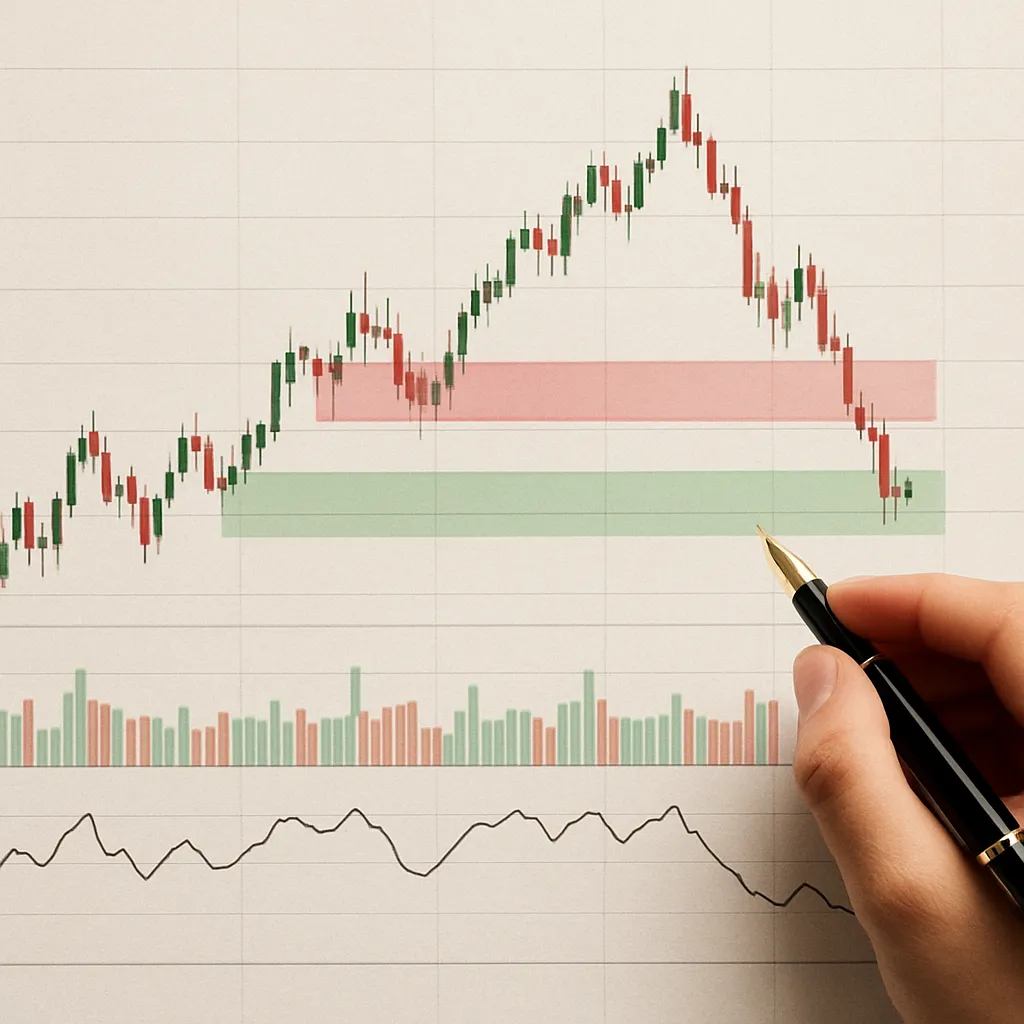
Mastering the art of recognizing and trading market exhaustion patterns can significantly elevate a trader’s performance in foreign exchange. By focusing on the subtle cues that indicate a trend is losing steam, traders can position themselves for high-probability entries and exits. This article explores essential concepts, common patterns, actionable techniques, and prudent risk controls to help you capitalize on critical turning points in currency markets.
Understanding Market Exhaustion in Forex
Market exhaustion occurs when a prevailing trend loses its sustaining force, signalling a potential reversal or consolidation. In a bullish phase, buyers gradually become less willing to push prices higher, leading to slower advances or sudden pullbacks. Conversely, in a bearish trend, sellers may hesitate to drive prices further down, producing shallow declines or abrupt recoveries. Recognizing exhaustion requires analyzing price action, volume, and momentum indicators to detect diminishing participation.
Key drivers behind exhaustion include shifts in supply and demand dynamics, profit-taking by institutional players, and exhaustion of available liquidity. High-profile economic releases can force traders to close positions, while central bank interventions may abruptly change market sentiment. Thus, combining technical analysis with awareness of fundamental catalysts enhances the odds of spotting genuine exhaustion.
Role of Momentum and Divergence
Momentum oscillators, such as the Relative Strength Index (RSI) or Moving Average Convergence Divergence (MACD), play a pivotal role. When price makes a new high but the oscillator fails to follow suit, a divergence emerges, suggesting the trend’s strength is waning. Similarly, if price records a new low but momentum is muted, sellers may lack conviction. Such divergences serve as early warnings that exhaustion may be imminent.
Volume and Volatility Clues
Volume often contracts as a trend matures, reflecting fewer participants willing to join the move. In a strong uptrend, declining volume on each successive rally hints at fading demand. In choppy sessions, spikes in volume associated with long wicks or reversal candles can mark climactic moves. Meanwhile, periods of low volatility may precede explosive breakouts; when combined with reversal patterns, they signal a ready-to-rock market that flips direction.
Identifying Common Exhaustion Patterns
Candlestick formations and chart patterns can pinpoint exhaustion with greater precision. Traders should familiarize themselves with classic reversal setups and contextually interpret them within larger timeframes.
Piercing Patterns and Engulfing Formations
Bullish and bearish engulfing patterns occur when a candle completely covers the body of the previous one, indicating a sudden shift in control. A bullish engulfing in a downtrend suggests buyers overpowered sellers, while a bearish engulfing at market tops hints at a fresh wave of selling pressure. The stronger the preceding trend, the more significant the exhaustion signal.
Head and Shoulders and Double Tops/Bottoms
Chart patterns like Head and Shoulders or Double Tops/Bottoms often presage trend reversals. In a Head and Shoulders, a higher peak flanked by two lower peaks signals a reversal of an uptrend when the neckline is breached. Conversely, a Double Bottom shows that sellers failed to push prices lower twice, creating a potential floor. Recognition of these structures relies on confirming breakouts accompanied by increased volume.
Exhaustion Gaps and Climax Tops
Gaps in forex may be less frequent than in equities, but they do occur around major news events or liquidity breaks. An exhaustion gap emerges when price gaps sharply but rebounds or stalls, reflecting an overextension of sentiment. Climax tops—identified by wide-ranging candles with long wicks—signal aggressive last stands by buyers or sellers before the market flips direction.
- Doji and Morning/Evening Star candlesticks reveal indecision and potential turning points.
- Rising and falling wedges highlight weakening momentum before breakdowns or breakouts.
- Spike-and-dome tops often feature extended tails and rapid reversals under heavy volume.
Trading Techniques for Market Exhaustion
Once exhaustion patterns are identified, adopting robust entries and exits is crucial to capitalize on the impending reversal. Below are practical tactics to enhance accuracy and timing:
Breakout and Pullback Entries
After recognizing a validated pattern—such as a neckline break in a Head and Shoulders—traders can enter on a breakout candle close. Alternatively, waiting for a pullback to a broken support or resistance level offers a second chance at a more disciplined entry with defined risk. This method relies on price retesting prior inflection zones, confirming the shift in market structure.
Momentum Confirmation
Combining price patterns with an oscillator filter enhances conviction. For instance, entering a long position only when RSI rises above 50 after a double bottom ensures that the new up move has underlying momentum. Likewise, a MACD histogram crossing from positive to negative after a bearish exhaustion pattern confirms sellers’ reassertion of control.
Position Sizing and Scaling
A prudent strategy involves scaling into positions. Traders can commit a portion of their intended size at the breakout and add to the position on further confirmation—such as a retest or a higher high in price. This technique reduces the impact of false breakouts and allows for more flexible adjustments as the market evolves.
- Define entry triggers, such as candle closes beyond pattern boundaries.
- Set initial stops just beyond pattern extremes, ensuring tight risk control.
- Employ trailing stops or moving averages to lock in profits as the new trend develops.
Risk Management and Execution
Proper risk control is essential when trading exhaustion, given the potential for false signals in volatile markets. Traders must map out clear rules for stop placement, trade sizing, and trade management.
Stop Loss Placement
Optimal stops rest beyond key pattern points—such as the shoulder in a Head and Shoulders or the recent swing high/low. Position size is determined by distance to stop and maximum acceptable drawdown. Limiting any single trade to a small percentage of account equity preserves capital for future opportunities.
Monitoring Liquidity and News
Currency markets can become thin around holidays or between major sessions, leading to erratic moves. Avoid initiating exhaustion trades just before significant economic announcements. Staying aware of the economic calendar prevents getting caught in unexpected volatile swings. If a surprise release triggers whipsaws, patience and discipline guard against reactive positions.
Journaling and Performance Review
Systematic recording of all exhaustion trades—detailing pattern type, entry and exit levels, outcome, and emotional factors—builds a feedback loop for improvement. Analyzing which patterns yield the best results under specific market conditions refines your future strategy and bolsters confidence.
- Review losing trades to pinpoint common mistakes, such as premature entries or ignored divergence signals.
- Track positive expectancy by calculating average gain versus average loss.
- Adjust pattern filters and confirmation rules based on statistical insights to maximize edge.