Mastering the art of trading around support levels can dramatically improve your success rate in the volatile world of foreign exchange. By honing in on well-defined support zones, you position yourself to identify areas where buyers are most likely to step in, creating opportunities for high-probability trades. In this article, you will learn how to pinpoint these critical areas, combine them with other tools, manage your risk effectively, and avoid common pitfalls—all while strengthening your overall trading edge.
Understanding Support Zones
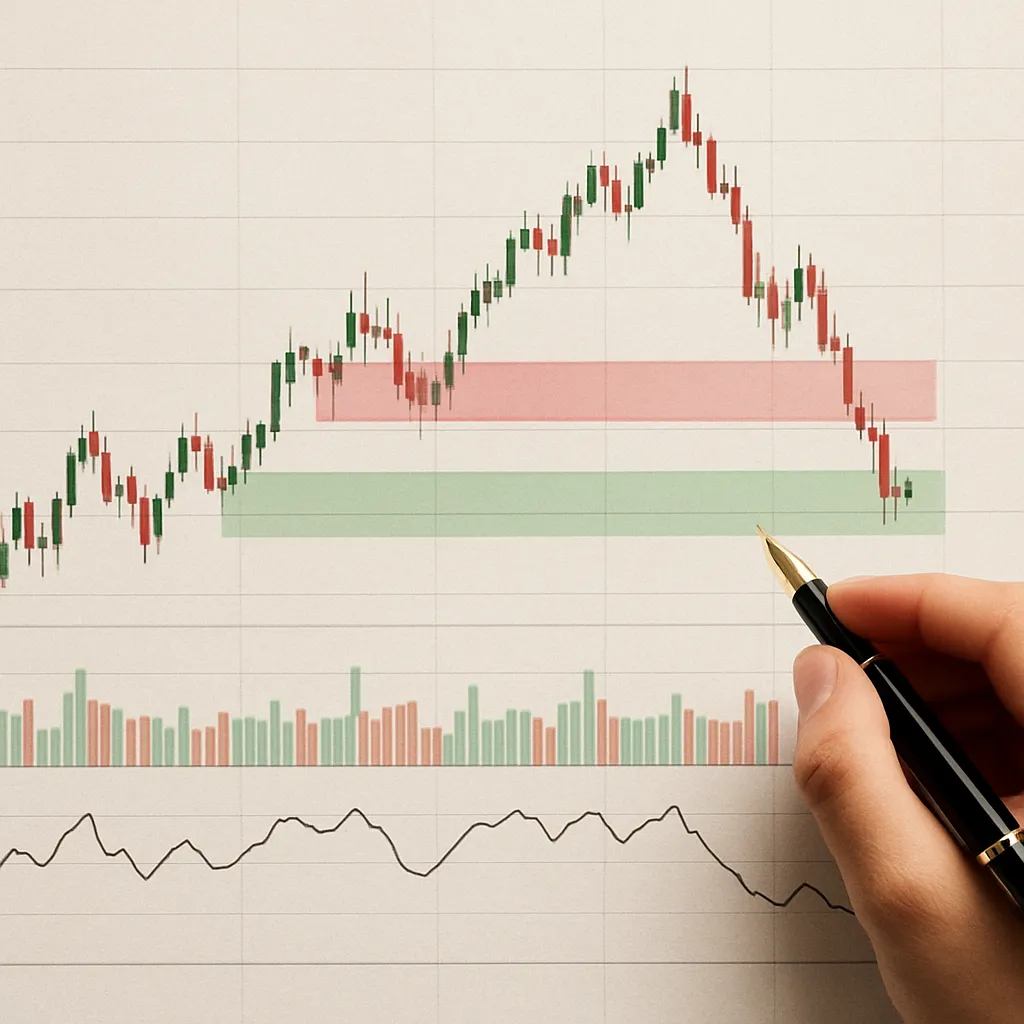
At its core, a support zone is an area on a price chart where downward momentum slows, and buying pressure emerges. Using technical analysis, traders mark these areas by connecting multiple swing lows to create a horizontal or slightly sloping band. A well-drawn zone respects previous tests of price, highlighting support zone boundaries that often act as a magnet when price revisits them. In trending markets, support zones provide reference points to enter pullbacks, while in range-bound conditions, they serve as reliable bounce levels.
Analyzing market structure is essential: watch for higher lows in an uptrend or a cluster of lows in sideways action. The more times price touches this zone without breaking below, the stronger the level becomes—and the more attractive it is for a buy entry. Traders should adjust these zones dynamically, shifting them if a minor breach occurs but is swiftly reclaimed, signifying that bulls remain in control.
Identifying High-Probability Trading Setups
Simply spotting a support zone is not enough. You need to wait for confirmation signals that buyers are re-entering the market before pulling the trigger. Here are two key methods:
Price Action Patterns
Look for reversal candlestick patterns such as pin bars, inside bars, or bullish engulfing formations right at or slightly above your support zone. For example, on the EUR/USD daily chart, imagine a zone between 1.1480 and 1.1500. A sharp bullish engulfing candle that closes well into this range suggests strong buyer conviction. Combining such patterns with volume spikes or long lower wicks often signals the end of the correction and the resumption of the primary trend.
Multiple Timeframe Analysis
Applying a top-down approach helps filter out noise and align your trades with the bigger picture. On a 4-hour chart, you might see a clear support zone, while your 1-hour chart provides entry timing. If the 4-hour zone between 1.1480–1.1500 coincides with a 1-hour cluster of bullish pin bars, you’ve identified a confluence of support. This dual confirmation boosts your confidence and refines your stop-loss placement just below the most extreme wick, reducing unnecessary risk.
Combining Support with Indicators
While price action is king, a few well-chosen indicators can enhance clarity. For instance, a rising 50-period moving average may intersect your support zone, reinforcing the likelihood of a bounce. Overlaid Bollinger Bands can show that price is touching the lower band within the support zone, hinting at oversold conditions. An RSI reading below 30 at the same level adds another layer of validation. This multi-tool approach—anchored by trend identification—turns a simple support zone into a powerful launchpad for trades.
When layering indicators, keep complexity to a minimum. Too many overlapping signals can lead to paralysis. Select one momentum oscillator, one trend filter, and rely on pure price action for the final entry decision. This balanced strategy helps you remain nimble and reactive, rather than bogged down by conflicting data.
Timeframe Selection and Trade Management
Choosing the right timeframe is paramount. Swing traders often work on daily or 4-hour charts to capture larger moves, while intraday traders may focus on 15-minute or 1-hour charts. The key is consistency: if you identify a zone on the daily chart, avoid entering on a 5-minute signal that may not respect the higher-timeframe context. Instead, wait for a 1-hour setup that aligns with the daily zone.
Once in a trade, actively manage your position. Consider scaling in half your intended size at the initial signal and adding the rest on a pullback within the same zone. Use a trailing stop just below each swing low to lock in profits as price advances. A structured approach to trade entries and scaling-out guards against sudden reversals and secures gains.
Implementing Effective Risk Management
Even the best setups can fail. That’s why robust risk management is non-negotiable. Treat each trade as a business transaction, with predefined entry, exit, and position size. Ensure that no single loss jeopardizes more than 1–2% of your trading capital.
- Define position size based on the distance between entry and stop-loss, adjusted for account balance.
- Place your stop-loss below the support zone’s lowest point or recent swing low to avoid random volatility.
- Use a reward-to-risk ratio of at least 2:1; if you risk 50 pips, aim for 100 pips in profit.
- Track your trades in a journal, noting why you entered, how the currency pairs behaved, and lessons learned.
Common Mistakes to Avoid
- Chasing breakouts without waiting for a clear retest of the support zone.
- Ignoring the overall trend and trading against it.
- Overleveraging in search of quick gains, leading to large drawdowns.
- Neglecting psychological discipline, such as moving stops or adding to losers.
- Failing to adjust zones after significant market structure shifts.