Achieving consistent success in the dynamic world of foreign exchange requires tools that offer both clarity and depth. Among the most respected is the Ichimoku Cloud, a comprehensive indicator that synthesizes multiple data points into a single visual framework. By mastering its components and learning how to interpret its signals, traders can gain insights into market trend, support and resistance levels, and potential entry or exit points with greater confidence.
Understanding the Ichimoku Cloud
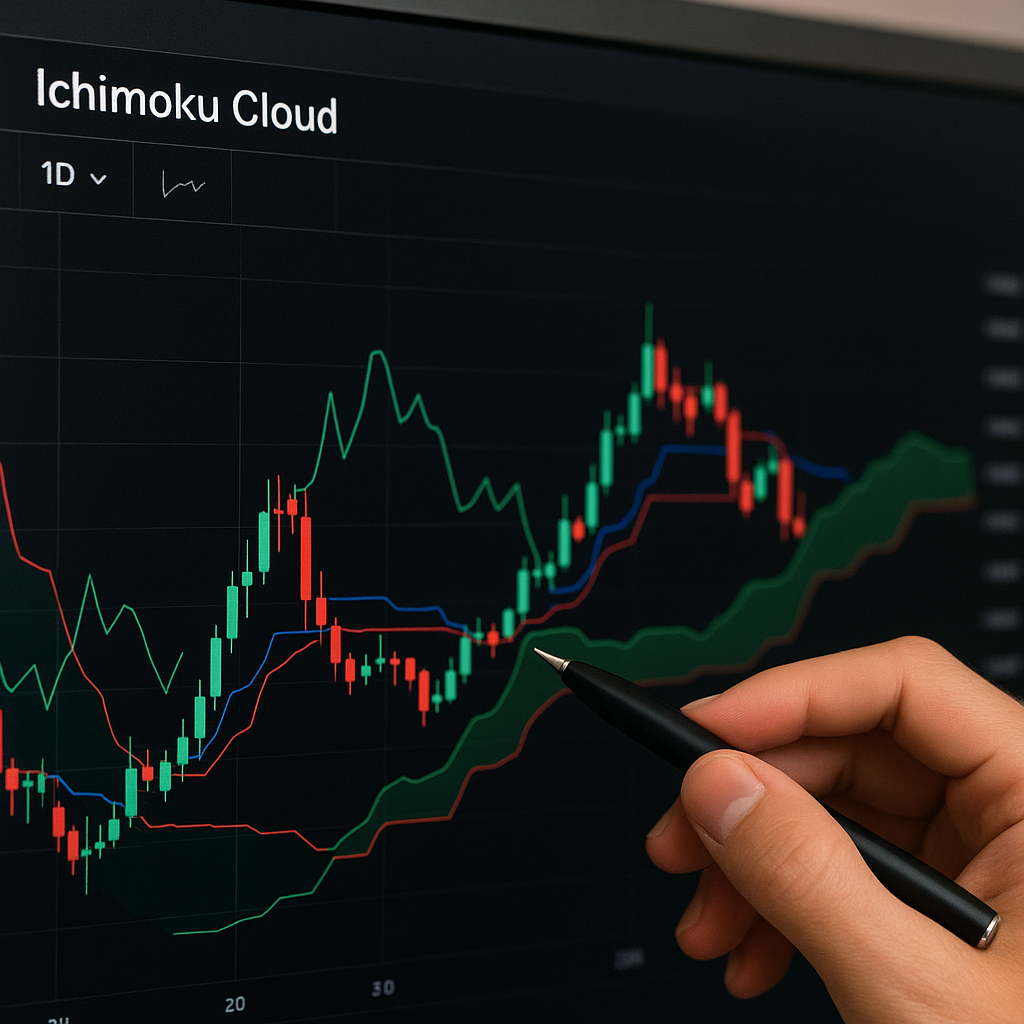
The Ichimoku Cloud, also known as Ichimoku Kinko Hyo, was developed by Goichi Hosoda in the late 1930s and refined over decades. Unlike traditional moving averages, it combines five distinct lines to provide a multidimensional view of price action. Its primary objective is to depict equilibrium and momentum on a chart, making it easier to spot emerging trends and potential reversals at a glance.
At its core, the Cloud consists of two boundary lines that form a shaded area. When the price is above the Cloud, it indicates bullish conditions; when below, it suggests bearish sentiment. Traders often watch for price crossing the Cloud as an early indication of market shifts. The thickness of the Cloud further acts as a proxy for market volatility—thicker clouds suggest stronger levels of support or resistance.
One of the key strengths of the Ichimoku system lies in its simplicity of interpretation. By integrating all components into a unified display, it reduces the need for multiple standalone indicators. This holistic approach helps prevent conflicting signals and keeps the chart clean, allowing traders to make swift, informed decisions.
Components of the Ichimoku System
The Ichimoku Cloud is constructed from five main elements, each offering unique insights into price dynamics:
- Tenkan-sen (Conversion Line): Calculated as the midpoint between the highest high and lowest low over the past nine periods. It reflects short-term momentum. A rising Tenkan-sen signals increasing bullish momentum, while a falling line indicates bearish pressure.
- Kijun-sen (Base Line): Similar to the Tenkan-sen, but calculated over 26 periods. It represents medium-term momentum and often serves as a dynamic support or resistance level.
- Senkou Span A (Leading Span A): The midpoint of the Tenkan-sen and Kijun-sen, plotted 26 periods ahead. It forms one boundary of the Cloud and helps forecast future price zones.
- Senkou Span B (Leading Span B): The midpoint of the highest high and lowest low over 52 periods, also plotted 26 periods ahead. Together with Senkou Span A, it shapes the Cloud’s boundaries.
- Chikou Span (Lagging Span): The current closing price plotted 26 periods behind. This line offers confirmation of trends by comparing current price action to past levels.
Each component plays a pivotal role in analyzing market conditions. For example, the cross of the Tenkan-sen and Kijun-sen creates a signal similar to a moving average crossover, while the position of the price relative to the Cloud gauges overall trend direction. Traders often look for confluence among these signals to strengthen their trade setups.
Applying Ichimoku in Real-Time Trading
Implementing the Ichimoku Cloud effectively demands practice and a clear trading plan. Below are key strategies to consider:
- Trend Identification: Observe the Cloud’s color and thickness. A green Cloud (Senkou Span A above Senkou Span B) suggests bullish bias, while a red Cloud indicates bearish conditions. The thicker the Cloud, the stronger the expected support or resistance.
- Tenkan-Kijun Cross: A bullish signal occurs when the Tenkan-sen crosses above the Kijun-sen, especially if this happens above the Cloud. Conversely, a bearish signal forms when the Tenkan-sen crosses below the Kijun-sen, particularly below the Cloud.
- Cloud Breakouts: Price breaking above the Cloud can signal the start of a new uptrend, whereas a break below may indicate a downtrend. Traders often wait for a daily close beyond the Cloud to confirm the breakout.
- Chikou Span Confirmation: Use the Chikou Span to validate signals. A bullish setup is stronger when the Chikou Span is above past prices, and bearish setups gain conviction when it lies below.
- Support and Resistance Levels: Both Senkou Span A and Senkou Span B act as dynamic levels. In trending markets, pullbacks to these boundaries can offer high-probability entry points.
Combining Ichimoku signals with other forms of analysis—such as candlestick patterns or volume indicators—can further enhance precision. For instance, a bullish Tenkan-Kijun cross meeting a hammer candlestick near the Cloud’s edge can constitute a compelling long-entry opportunity.
Tips for Effective Use
To maximize the benefits of the Ichimoku Cloud in your Forex trading, consider these practical pointers:
- Adjust the standard periods (9-26-52) only after thorough backtesting, as the default settings often align well with many currency pairs.
- Avoid taking signals in highly choppy or range-bound markets, where the Cloud may generate false breakouts.
- Keep position size in check and use proper risk management; Ichimoku should complement—not replace—a disciplined money-management approach.
- Monitor higher timeframes to confirm major trend direction before trading lower timeframes for entry precision.
- Combine Ichimoku with a simple oscillator, like RSI, to detect divergence and improve timing.
Mastery of the Ichimoku Cloud takes time, but by focusing on its core lines and observing how they interact with price, you can develop a robust framework for identifying and capitalizing on momentum shifts in the Forex market.