Navigating the complex world of foreign exchange often relies on structured data captured in a spreadsheet. By mastering the layout and analysis techniques behind these documents, traders can make informed decisions, minimize errors, and adapt strategies in real time. This article delves into essential concepts, key components, advanced methods, and best practices to help you confidently read and understand forex spreadsheets.
Understanding the Basics of Forex Spreadsheets
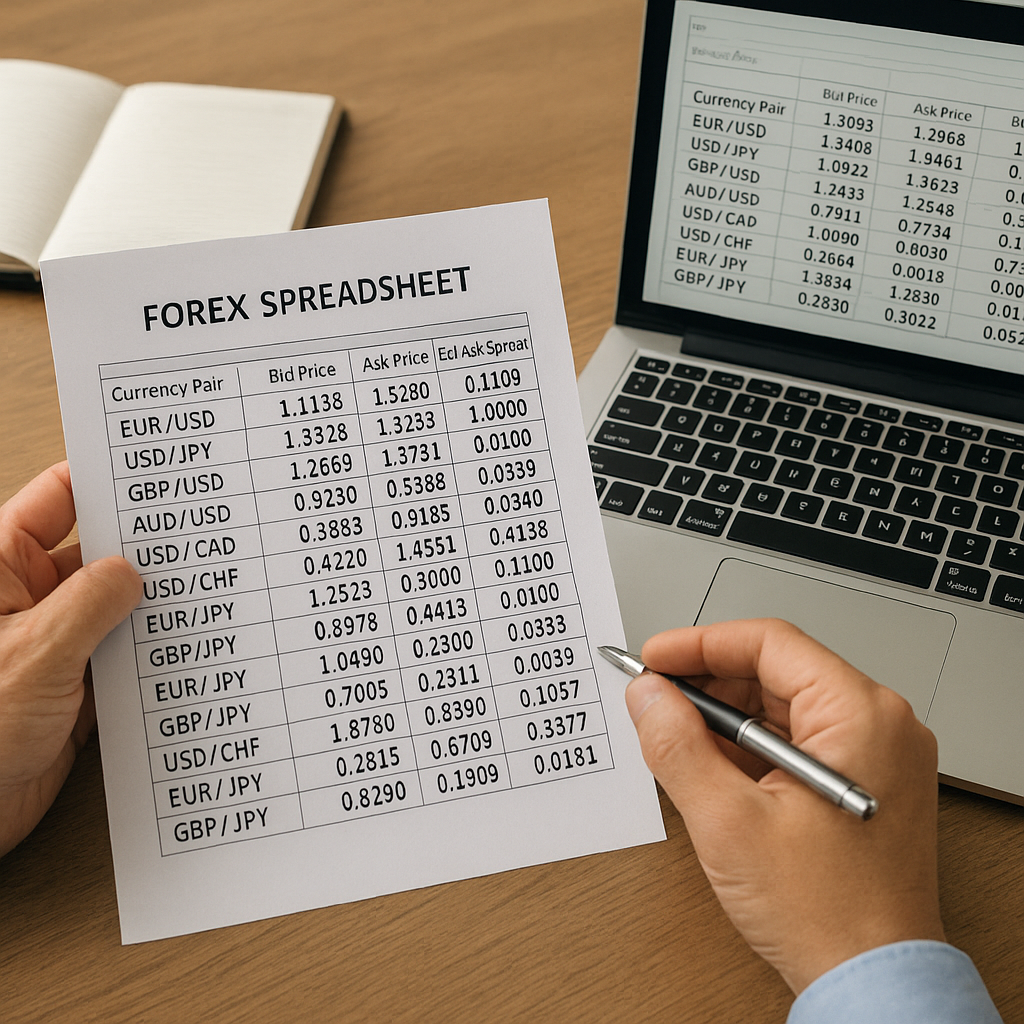
Every forex spreadsheet functions as a dynamic tool for organizing prices, trade entries, and performance metrics. Before diving into formulas or indicators, it’s crucial to become familiar with the foundational elements: rows, columns, cell references, and data formats. Consistency in labeling and formatting leads to fewer errors and faster interpretation.
Common Terminology
- Currency pair: Represents two currencies being traded against each other (for example, EUR/USD).
- Pip: The smallest price move in an exchange rate, typically the fourth decimal place.
- Bid-ask spread: The difference between the buying (bid) and selling (ask) prices.
- Volatility: A measure of how much a currency’s value fluctuates over a period.
- Liquidity: The ease with which a currency can be bought or sold without affecting its price.
Key Components of an Effective Forex Spreadsheet
Well-organized data lays the groundwork for accurate analysis. A typical forex spreadsheet includes separate sections for raw market data, trade details, performance metrics, and charts. Grouping related data into distinct tables and using freeze panes for headers ensures readability, even as the dataset grows.
Market Data Section
- Date and time stamps for each quote
- Bid and ask prices, highlighting the bid-ask spread dynamically
- Columns for high, low, open, and close values
Trade Log Section
- Entry and exit points with timestamps
- Trade size and direction (long or short)
- Stop-loss and take-profit levels for effective risk management
- Profit and loss calculation per trade, often expressed in pips
Performance Metrics Section
Comparing historical and current performance helps traders refine strategies.
- Win rate percentage
- Average pip gain or loss per trade
- Maximum drawdown to gauge worst-case losses
- Sharpe ratio or other risk-adjusted metrics
Analyzing Data with Advanced Techniques
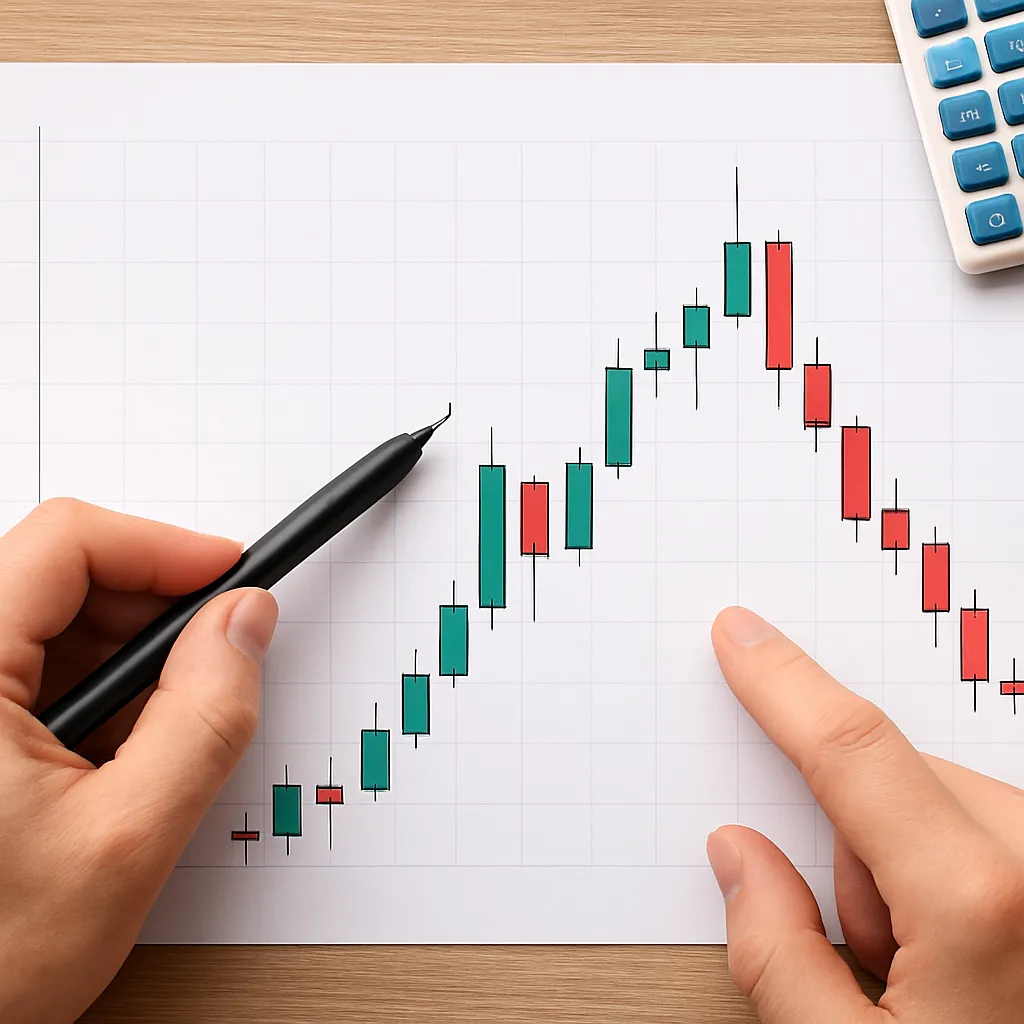
Once data is captured, leveraging formulas, functions, and visualization can reveal patterns and opportunities in forex markets. Advanced analysis often relies on combining numerical data with graphical elements like charts and heat maps.
Utilizing Formulas and Functions
Common spreadsheet functions accelerate calculations across large datasets:
- SUMIFS and COUNTIFS: Aggregate profits, losses, or trades meeting specific criteria.
- VLOOKUP or INDEX/MATCH: Pull reference data, such as swap rates or commission fees.
- MAX and MIN: Identify the highest and lowest prices within a date range.
- STDEV: Measure exchange-rate volatility over a defined period.
Incorporating Technical Indicators
Many traders integrate well-known indicators directly into their spreadsheets. By calculating moving averages, relative strength index (RSI), and MACD values, you can spot potential trend reversals or continuation signals without switching platforms.
- Simple Moving Average (SMA) and Exponential Moving Average (EMA)
- RSI formulas based on average gains and losses
- Bollinger Bands to visualize price dispersion
Analyzing Historical Data
Examining past performance helps anticipate future behavior. By creating pivot tables or line charts that map daily closing prices, traders can detect seasonality or recurring patterns in currency movements.
Tips and Best Practices for Spreadsheet Management
Maintaining accuracy and efficiency in your forex spreadsheets demands careful attention to detail, proper version control, and routine backups. These practices guard against data corruption and ensure seamless updates.
Version Control and Collaboration
When multiple traders or analysts work on the same file, implementing a clear naming convention and change log prevents confusion. Tools like Google Sheets or cloud-based drives with version history simplify collaboration.
Data Validation and Error Checks
Preventing mistakes is easier than troubleshooting complex formulas. Employ data validation rules to restrict entries (e.g., dates only within trading hours) and conditional formatting to highlight outliers, such as extreme leverage values or oversized positions.
Automating Data Imports
Manual data entry consumes time and invites typos. Many brokers and data-providers offer API connections or CSV downloads. Automating imports through built-in spreadsheet features or simple scripts ensures real-time updates and accurate display of live liquidity conditions.
Designing a Risk-Focused Spreadsheet
A dedicated risk assessment sheet complements your trading log. Embedding risk calculations and visual alerts allows immediate insight into exposure levels across positions, currency pairs, or trading accounts.
Position Sizing and Risk Management Models
- Kelly Criterion or fixed-risk percentage per trade
- Dynamic stop-loss adjustments based on market volatility readings
- Correlation matrices to avoid overexposure to related currency moves
Stress Testing Scenarios
Simulate adverse price moves by adjusting entry and exit columns. Lookup worst-case drawdowns and calculate potential margin calls under different stress levels. This proactive approach helps ensure your account withstands sudden market shifts.
Maintaining and Expanding Your Forex Spreadsheet
As trading strategies evolve, so should your spreadsheet. Continuous refinement—whether adding new indicators, refining data sources, or enhancing visualization—keeps your analysis cutting-edge and aligned with market innovations.
- Archive outdated data in separate sheets to preserve performance metrics over time.
- Explore custom scripting (e.g., VBA or Google Apps Script) to build bespoke functions or automated alerts.
- Regularly audit formulas to remove redundant calculations and improve loading speed.
Final Thoughts on Long-Term Spreadsheet Efficiency
Consistency, accuracy, and adaptability form the triad of an effective forex spreadsheet. By mastering the basics, incorporating advanced analysis tools, and following best practices, you position yourself to manage trades confidently, mitigate risks, and capitalize on opportunities across global currency markets.