The use of Fibonacci retracement offers traders a systematic way to identify potential turning points in the market. This tool, rooted in a sequence of numbers first introduced by Leonardo Pisano Bigollo, has become a staple in the arsenal of many forex professionals. By analyzing key retracement levels derived from Fibonacci ratios, traders can pinpoint areas of support and resistance, gauge the strength of a trend, and refine their entries and exits. The following sections explore how to effectively apply Fibonacci retracement to currency trading, highlighting practical tactics and risk controls.
Introduction to Fibonacci Retracement Concepts
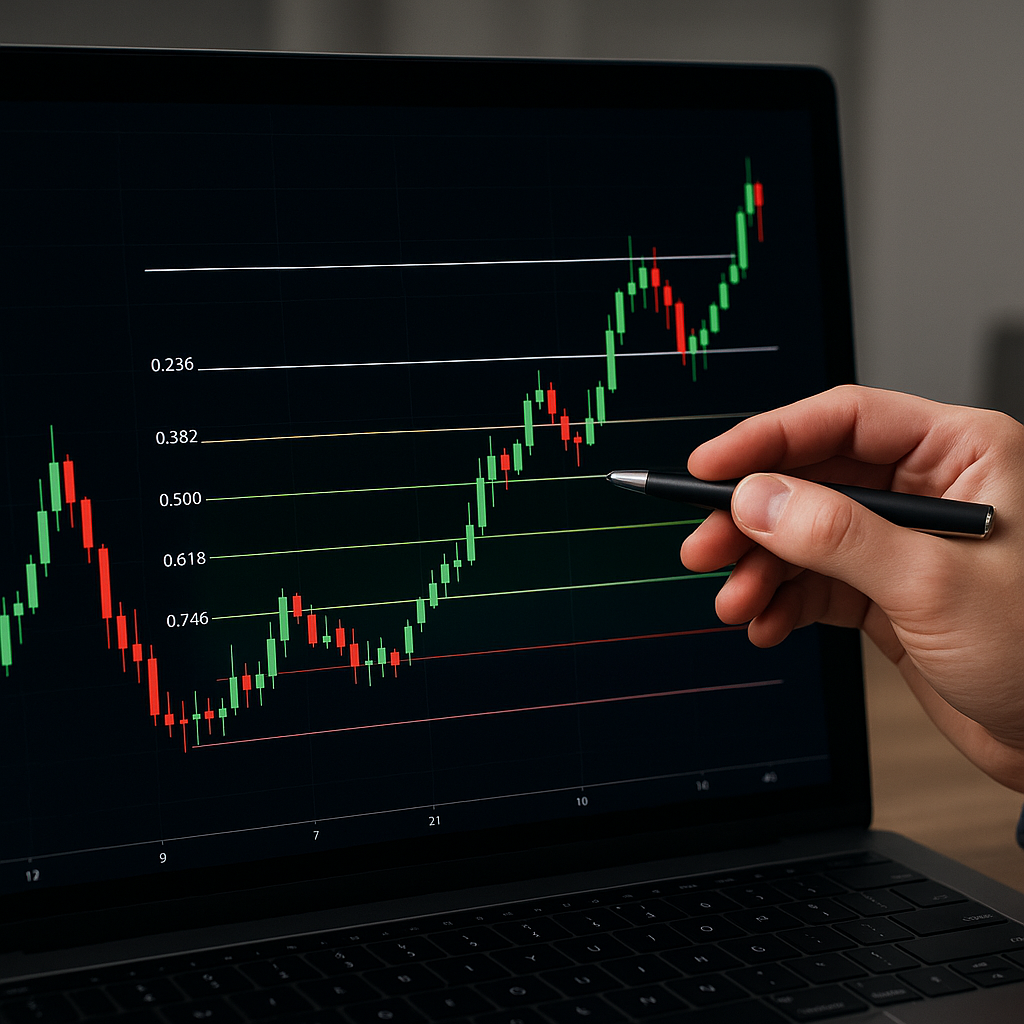
At its core, Fibonacci retracement is based on mathematical relationships observed in the famous sequence. Key ratios—23.6%, 38.2%, 50%, 61.8%, and 78.6%—are plotted between a high and low point on a price chart. These levels act as potential support or resistance zones where price may stall or reverse.
Unlike static horizontal lines, Fibonacci levels adjust dynamically to the selected swing high and low, creating a tailored grid. When price approaches these zones, traders look for corroborating signals—candlestick patterns, trendline tests, or momentum divergences—to confirm the validity of the level.
Because the forex market moves rapidly, deploying Fibonacci retracement demands both speed and precision. Automated charting platforms allow traders to instantly draw retracement lines, but identifying high-probability setups still requires human judgment. Combining Fibonacci analysis with volume data, moving averages, or oscillators can increase confidence in potential reversal points.
Successful implementation depends on defining a clear trending phase. During strong uptrends, retracements toward the 38.2% or 50% level often represent attractive pullbacks. In slower trends or ranging conditions, the 61.8% or even 78.6% levels may see price reversals. Recognizing the prevailing market structure is essential.
- Identify Swing Points: Look for clear, well-defined highs and lows.
- Align With Trend: Confirm retracements within the broader trend direction.
- Use Confirmation: Seek supporting signals like engulfing candles or divergences.
- Manage Risk: Place stops beyond the next Fibonacci level or recent swing extreme.
By integrating these steps, traders can turn Fibonacci retracement into a robust analysis tool that complements other strategies and indicators.
Applying Fibonacci Levels to Currency Pairs
Different currency pairs exhibit unique volatility and liquidity characteristics. Major pairs like EUR/USD or GBP/USD tend to respect Fibonacci levels more reliably due to high trading volumes, while exotic pairs may display erratic moves that cause false signals. Adjusting timeframes is critical:
Short-Term Charts: On 1-minute to 15-minute charts, Fibonacci levels can help scalp quick reversals, but noise is high. Traders often use tighter stops and lower position sizes.
Medium-Term Charts: H1 to H4 timeframes provide a balance of noise reduction and trade frequency. Swing traders can capture moves from one retracement level to the next.
Long-Term Charts: Daily and weekly charts are favored by position traders. These timeframes filter market clutter and highlight major support-resistance confluences.
Establishing the Trend Swing
Before drawing retracement lines, pinpoint the dominant swing low (for a bullish trend) or swing high (for a bearish trend). A misidentification can lead to skewed levels and suboptimal trade signals. Consider these guidelines:
- Wait for a confirmed break of the previous high or low to validate trend direction.
- Use multiple timeframe analysis—confirm a trend on higher timeframes before refining entry levels on lower timeframes.
- Mark the most recent significant peak and trough, avoiding small, choppy fluctuations.
Key Retracement Zones and Price Reactions
When price approaches a Fibonacci level, traders watch for specific behaviors:
- Rejection Wicks: Long wicks at Fibonacci levels suggest strong support or resistance.
- Doji or Engulfing Patterns: These candlestick setups signal indecision or reversal near critical zones.
- Divergence: Oscillators like RSI showing divergence at a retracement level can reinforce reversal odds.
For example, in an uptrend on EUR/JPY, price may retrace to the 61.8% level and form a bullish engulfing candle. A confirmed close above the retracement line could serve as a signal to initiate a long position, with a stop placed below the 78.6% level or the recent swing low.
Advanced Strategies and Risk Management
Seasoned traders often combine Fibonacci retracement with additional tools to create powerful trading systems. Here are some advanced methods:
Confluence Trading
Confluence occurs when multiple concepts align at the same price area. Examples include:
- Fibonacci retracement level meeting a horizontal support line.
- Trendline intersecting with the 50% retracement level.
- Moving average cluster near the 38.2% or 61.8% level.
This overlap enhances the probability of a successful reversal or breakout. Mark these areas clearly on your chart and use tighter risk parameters, since confluence zones typically offer higher reward-to-risk ratios.
Scaling In and Out
Rather than betting full capital at a single price, consider scaling into positions at successive retracement levels:
- Place initial entry at 38.2% with 50% of intended size.
- Add to the position at 50% retracement if the level holds, adding another 25% size.
- Complete the position at 61.8% for maximum leverage.
When exiting, use partial closes at profit targets aligned with Fibonacci extensions (e.g., 161.8%, 261.8%). This approach allows you to lock in gains and ride extended moves.
Position Sizing and Stop Placement
Effective risk management is as important as selecting the right Fibonacci level. Recommended practices include:
- Calculate risk per trade as a fixed percentage of account balance (e.g., 1-2%).
- Place stop-loss orders just beyond the next Fibonacci level or recent swing extreme.
- Adjust position size based on distance to stop, ensuring consistent monetary risk.
- Use trailing stops once price moves favorably, locking in profits and reducing drawdown.
By constraining risk, traders can survive inevitable losing streaks and let their winners run, capitalizing on the power of confluence and high-probability setups.
Conclusion:
Mastering Fibonacci retracement in forex trading requires practice in drawing accurate swing points, recognizing price behaviors at key levels, and integrating supplementary signals for confirmation. When combined with disciplined entries, prudent exits, and strict risk management, Fibonacci tools can guide traders toward more consistent performance in dynamic currency markets.