Understanding the intricate relationships between different forex pairs can unlock powerful insights for traders and investors. By examining how two currencies move in relation to each other, market participants can optimize strategies, manage exposure and build more resilient portfolios.
What Are Currency Correlations?
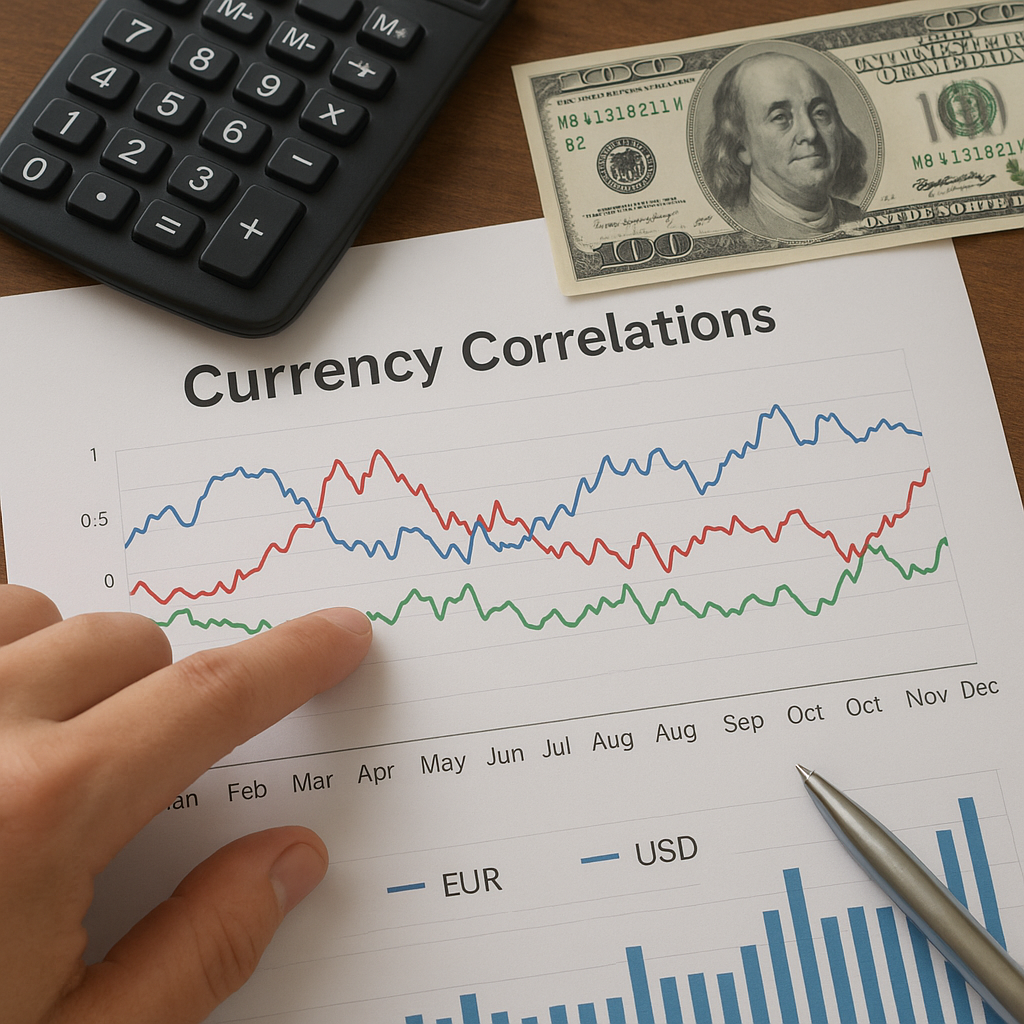
At its heart, a correlation in foreign exchange is a statistical measure that quantifies the degree to which two currency pairs move in tandem. Values range from +1 (perfect positive correlation) to –1 (perfect negative correlation), with zero indicating no linear relationship. Traders often refer to the Pearson coefficient when calculating this metric, as it provides a standard methodology for comparing daily or intraday returns across pairs.
For example, the EUR/USD and GBP/USD often exhibit a positive correlation because both are major currencies paired against the US dollar. Conversely, a pair like USD/CHF might move inversely to USD/JPY in certain market regimes, reflecting risk‐off flows or safe‐haven demand.
Factors Influencing Currency Correlations
Various economic, political and technical drivers can strengthen or weaken inter‐currency relationships:
- Role of macroeconomic factors: Inflation reports, GDP releases and employment figures can keep two currencies aligned or push them apart, depending on relative economic health.
- Commodity exposures: Pairs like AUD/USD and NZD/USD often track commodity prices. A drop in raw material demand can synchronize their downward moves.
- Interest rate differentials: Divergent central bank policies can alter the sign and strength of correlation graphs over time.
- Global risk sentiment: During market stress, safe-haven currencies (e.g., JPY, CHF) may pair off against riskier currencies like AUD, causing negative relationships to intensify.
- Institutional flows and trade patterns: Sustained buying or selling by large entities can create persistent cross‐currency momentum.
Mapping these connections requires assembling an underlined correlation matrix: correlation matrix visualization tools help traders spot clusters of highly interdependent pairs.
Measuring and Interpreting Correlations
Calculating the Coefficient
To compute the linear relationship between two series of returns:
- Collect synchronized price data for both currency pairs.
- Calculate periodic returns (e.g., daily percentage changes).
- Apply the Pearson formula: covariance of returns divided by the product of their standard deviations.
This yields a value between –1 and +1. Readings above +0.8 or below –0.8 signify strong relationships, while values near zero imply independence.
Rolling Window Analysis
Static correlation snapshots can be misleading because market dynamics shift over time. By using a moving or “rolling” sample—say 60 days—traders capture evolving relationships. Monitoring the trajectory of correlation lines can warn of impending breaks or reversals.
Statistical methods, such as the significance test for correlation coefficients, ensure that observed relationships are not due to random chance. Maintaining statistical significance reduces false signals in strategy implementation.
Trading Strategies Based on Correlation Analysis
Leveraging inter‐currency relationships can improve both offense and defense in FX trading:
- Diversification: By combining pairs with low or negative correlations, traders lower idiosyncratic risk within a single account.
- Hedging: When exposure to one currency pair turns unfavorable, a position in a negatively correlated pair can offset losses.
- Carry trade optimization: Pairing a long position in a high‐yielding currency with a short in a negatively correlated low‐yielding currency can enhance returns while reducing volatility.
- Risk management overlays: Correlation matrices feed into value‐at‐risk models, guiding position sizing and stop‐loss levels.
- Pairs trading: Identifying convergence or divergence in highly correlated pairs and executing offsetting trades to exploit mean‐reversion.
Well‐designed correlation strategies enhance overall risk management and support more balanced portfolio allocations.
Constructing a resilient portfolio involves selecting currency exposures that respond differently to macro shocks, central bank verdicts and geopolitical events.
Advanced Topics in Correlation Modeling
Beyond simple linear measures, traders can explore dynamic frameworks that capture time-varying dependence:
- Time-Varying Correlation Models: Techniques like the Dynamic Conditional Correlation (DCC-GARCH) allow correlation coefficients to adjust as market volatility regimes shift.
- Cointegration versus correlation: While correlation gauges short‐term comovement, cointegration tests reveal deeper, equilibrium‐driven relationships over longer horizons.
- Machine learning approaches: Clustering algorithms and principal component analysis can uncover latent structures among many currency pairs simultaneously.
However, caution is warranted. Spurious relationships can emerge during specific market episodes, only to vanish once new information arrives. Continuous monitoring and flexible risk controls are essential to ensure that correlation‐based signals remain robust.
By integrating both classical and advanced models, traders gain a more nuanced view of how global currencies interact under a variety of market pressures.