Bollinger Bands have become a staple for many retail and institutional traders seeking to gauge market volatility and identify potential entry or exit points. By combining a simple moving average with lines that represent standard deviation levels above and below it, this tool offers a dynamic envelope that expands and contracts based on price action. In the Forex market—where rapid swings and unexpected shifts can erode profits—understanding how to read and apply Bollinger Bands effectively can give traders a much-needed edge.
Understanding Bollinger Bands
Definition and Components
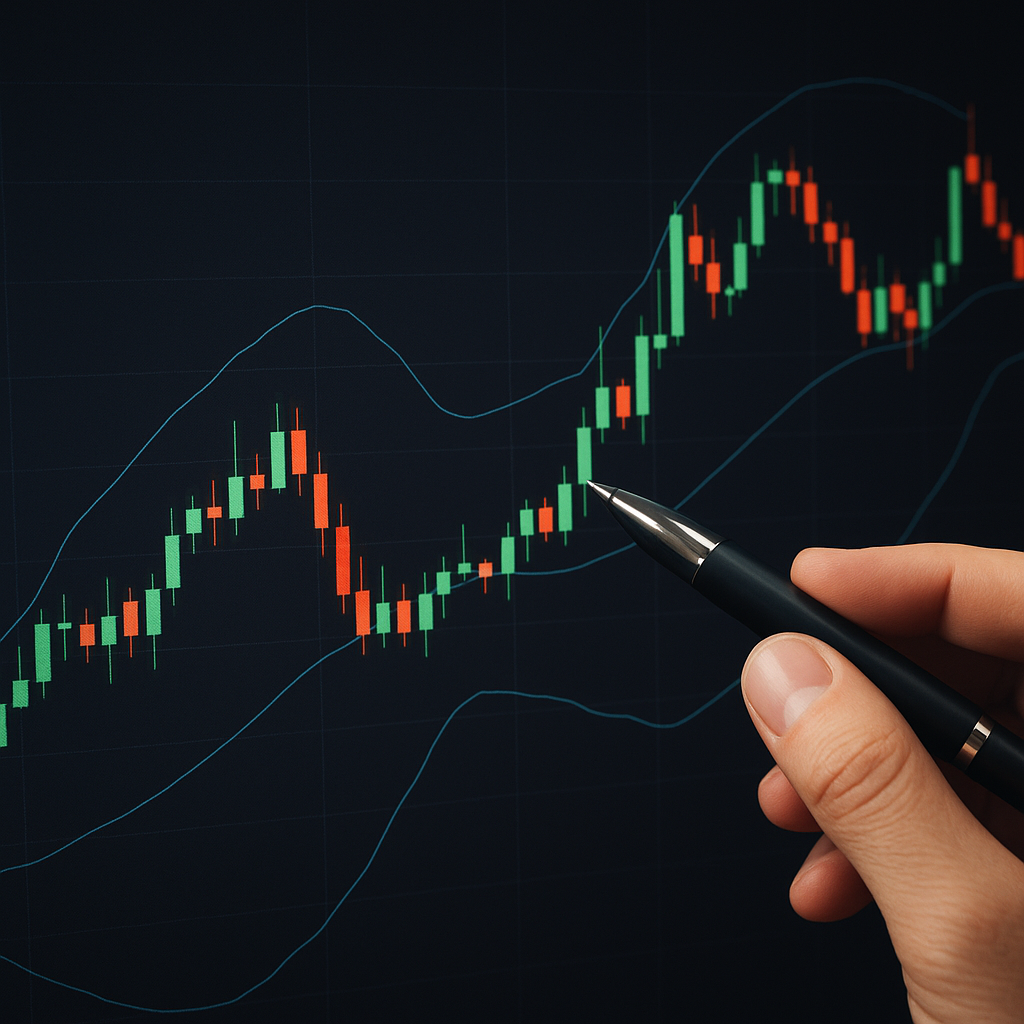
Bollinger Bands consist of three lines: a middle band (typically a 20-period moving average), an upper band set at two standard deviations above the middle band, and a lower band two standard deviations below. These parameters can be adjusted, but the default settings remain popular for capturing market patterns without too much noise.
Key Concepts
- Middle Band: Represents the average price over a chosen period, smoothing out short-term fluctuations.
- Upper Band: Indicates potential overbought conditions when price repeatedly touches or exceeds it.
- Lower Band: Marks possible oversold areas when price approaches or breaches it.
Setting Up Bollinger Bands in Forex Trading Platforms
Selecting Timeframes
Choosing the right timeframe is crucial. Intraday scalpers may prefer 1‐minute to 15‐minute charts to exploit micro-movements, while swing traders might rely on 4-hour or daily charts to capture larger trends. The principle remains the same: as the bands narrow (squeeze), volatility is low and a significant move may be imminent; as they widen, volatility is heightened and trend strength can be assessed.
Customization Tips
- Adjust standard deviation multipliers (e.g., 1.5 or 2.5) to fine-tune sensitivity.
- Combine with a volume indicator to spot false breakouts caused by thin liquidity.
- Overlay a Relative Strength Index (RSI) or MACD for additional confirmation of momentum shifts.
Trading Strategies Using Bollinger Bands
Bollinger Band Squeeze
The squeeze occurs when bands contract tightly around the middle average, signaling a period of low volatility. Traders watch for a breakout above the upper band or below the lower band to signal a new trend. A long position is considered when price closes above the upper band with expanding bandwidth, while a short position is initiated when price breaks below the lower band under similar conditions.
Double Bottoms and Tops
A “double bottom” setup forms when price dips near or below the lower band, rebounds to the middle band, and then retests the lower band without exceeding the initial low. This pattern often precedes a bullish reversal. Conversely, a double top near the upper band can forecast a bearish turn. Always seek additional signals—like bullish candlestick patterns—to confirm the setup.
Riding the Bands
In strong uptrends, price may “ride” the upper band, repeatedly bouncing off it as support. Traders can enter on minor pullbacks to the middle band and set profit targets near the upper band. The reverse applies in downtrends, where the lower band acts as dynamic resistance. This approach harnesses trend strength while maintaining disciplined stop-loss placement just outside the opposing band.
Combining Bollinger Bands with Other Indicators
RSI Divergence
Pairing Bollinger Bands with an RSI reading allows traders to spot hidden divergences. For example, if price hits a new low on the lower band but RSI forms a higher low, this bullish divergence can precede a trend reversal.
MACD Crossovers
Utilize the momentum gauge of the MACD histogram to confirm the direction after a Bollinger breakout. A MACD line crossing above the signal line following an upper-band breakout strengthens the case for a long trade.
Risk Management and Best Practices
Setting Stops and Targets
- Place initial stop losses just outside the opposing band to allow for noise without blowing out prematurely.
- Consider scaling out at the middle band or a key pivot level to lock in partial profits.
- Use a risk-reward ratio of at least 1:2 to ensure winners outweigh losers in the long run.
Avoiding Common Pitfalls
Beware of trading every touch of the bands. Markets can linger in overbought/oversold zones, trapping impatient traders. Instead, wait for clear band expansions or confluence with support/resistance levels. Treat Bollinger Bands as a guide rather than a standalone signal.
Adapting to Market Conditions
Forex pairs with high liquidity—like EUR/USD or USD/JPY—tend to respect band dynamics more reliably. Exotic pairs may whipsaw around the bands, requiring wider standard deviation settings or avoidance altogether during low-volume sessions. Monitor news events closely, as sudden breakouts can occur on economic releases, nullifying technical patterns.